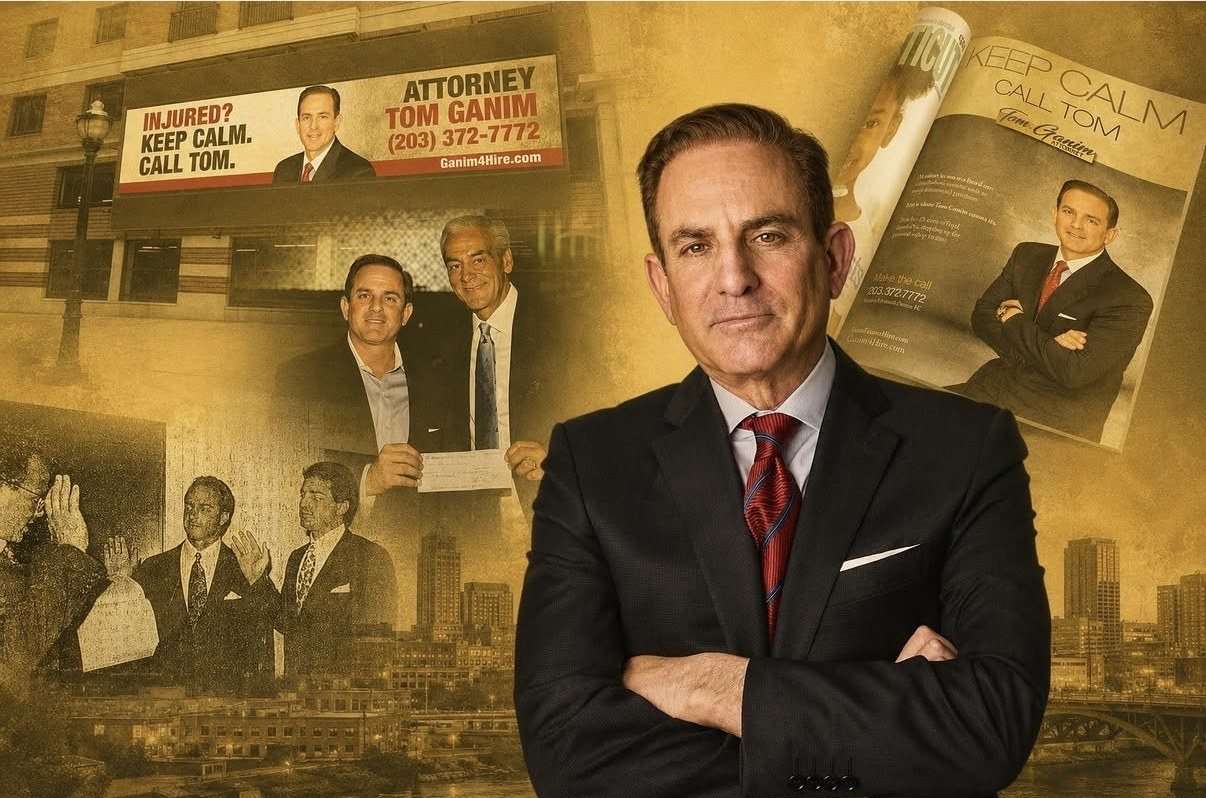
Keep calm.
Call Tom.
A Bridgeport trial attorney signed us in September 2025 to shoot social content and commercials. Eleven months later we run his billboards, his cable television, his website, his email funnel and his paid media — and his lead flow has gone from one a week to two, three, sometimes four.
He wasn't underspending.
He was buying the wrong half.
Tom Ganim has practiced law in Bridgeport for over 33 years, and he was already investing at the top end of what a firm his size spends — roughly half a million dollars a year. Nearly all of it went straight into rate cards: cable, billboards, radio. Almost none of it went into anything he'd still own at the end of the year.
Social content and commercials
The signed scope. Put him on camera, keep a steady stream of social going, produce spots that could run. Signed September 2025, shot that month, first deliverables live in October.
All media, no assets
A six-figure annual buy funding placements that expire the day the flight ends. No creative library, no system, and channels that didn't reinforce each other — plus a site that didn't convert and a funnel that didn't fire.
Same money, different shape
We negotiate and manage the media — billed direct to him, not marked up through us — and the savings and attention go into creative he keeps. One team from first impression to signed client.
Rate cards buy you attention until the flight ends. Everything we make, he still owns next year — and the year after that.
One discipline became six
The signed scope was social content and commercials. We never pitched for the rest — each line was handed to us after the previous one worked, which is the only kind of scope growth worth putting in a case study.
Social & Commercials
Vertical and horizontal cuts, reels, hooks and broadcast-ready spots. Built once, sliced for every placement.
Cable Television
Spots on News 12 and the YES Network, November 2025 through April 2026, with new flights rolling now. Local news and live sports — the two things this audience still watches in real time.
Billboards
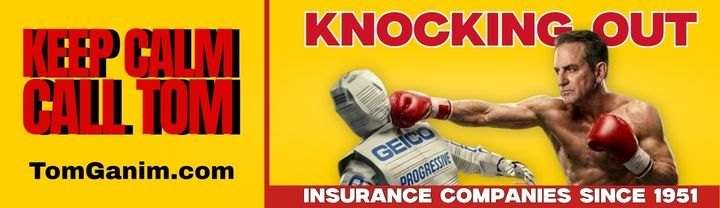
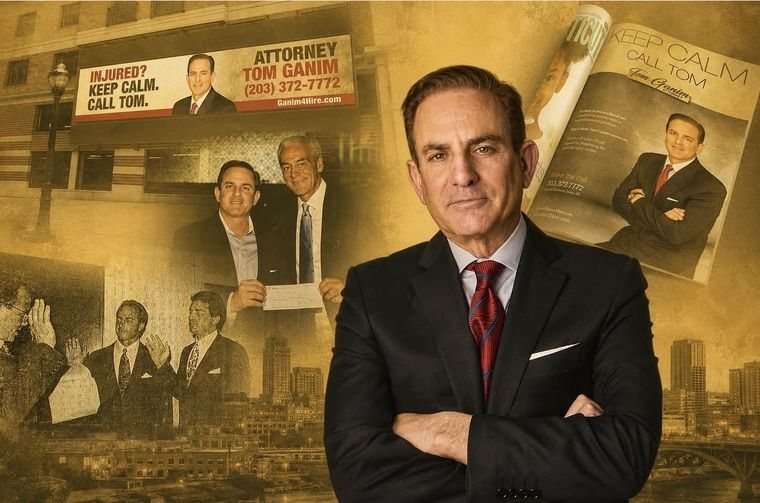
All out-of-home creative moved to us: 30+ boards produced, 10 months live on I-95. Same face, same line, same system as the social.
Website
tomganim.com rebuilt around a single job: turn a visitor into a free consultation. Practice areas, testimonials, media, and a form that actually gets filled.
Email Funnel
The follow-up sequence rebuilt and reconnected, so an inquiry gets a response whether or not anyone is at a desk.
Paid Media
Meta campaigns built, run and optimized in-house. Creative and media buying under one roof, so a winning hook becomes a winning ad the same week.
Before we added anything,
we stopped the leaks
Most of the lift didn't come from new spend. It came from fixing what was already there and pointing it all at the same target.
A website that described the firm
Traffic arrived and read. Practice areas were listed but not sold, and there was no clear next step from any page.
A website that books consultations
Rebuilt around "Get a free consultation. Right away." Testimonials and media coverage carry the proof; every practice area has its own path to the form. Form submissions went from zero to roughly two a week.
A funnel with nothing to catch
The site produced no form submissions at all, so there was nothing for a follow-up sequence to act on. No automated acknowledgement, no nurture, no second touch.
Every inquiry answered immediately
The rebuilt sequence fires on submission and keeps warming the ones who don't book on day one — now running against roughly two new submissions a week instead of none.
Channels that looked like strangers
Billboards, social and site each carried a different look. Nothing compounded — a person could see all three and never connect them.
One face, one line, everywhere
A single creative system across out-of-home, broadcast, social and paid. The board on the drive to work and the reel that night are the same campaign.
$8,193 of media.
794,705 impressions.
Eleven months of continuous paid social, October 2025 through August 2026. Every figure below is pulled directly from the ad accounts — nothing estimated, nothing excluded.
Impressions delivered by month
October 2025 – August 2026. Bar length is impressions; the figure beside it is that month's media spend.
Paid funnel — impression to landing page
All campaigns, full engagement to date. Each stage is an absolute event count.
Monthly ledger
Every month of paid delivery, in full.
| Month | Impressions | Spend | Clicks | CTR | CPM |
|---|---|---|---|---|---|
| Oct 2025 | 60,293 | $526.28 | 990 | 1.64% | $8.73 |
| Nov 2025 | 40,628 | $621.30 | 1,521 | 3.74% | $15.29 |
| Dec 2025 | 33,943 | $376.74 | 940 | 2.77% | $11.10 |
| Jan 2026 | 79,058 | $637.84 | 2,659 | 3.36% | $8.07 |
| Feb 2026 | 86,096 | $608.55 | 3,120 | 3.62% | $7.07 |
| Mar 2026 | 100,733 | $885.80 | 2,675 | 2.66% | $8.79 |
| Apr 2026 | 13,888 | $140.32 | 319 | 2.30% | $10.10 |
| May 2026 | 110,760 | $1,226.57 | 3,575 | 3.23% | $11.07 |
| Jun 2026 | 99,578 | $1,360.33 | 2,156 | 2.17% | $13.66 |
| Jul 2026 | 115,717 | $1,489.94 | 2,556 | 2.21% | $12.88 |
| Aug 1–11 2026 | 54,011 | $319.71 | 1,313 | 2.43% | $5.92 |
| Total | 794,705 | $8,193.38 | 21,824 | 2.75% | $10.31 |
"Knockout" — 37,117 ThruPlays
One spot, March–April 2026: 71,912 impressions and 37,117 completed views on $699.75 of media. It drew 54,698 engagements from 24,099 people — better than two interactions each.
"Arrested" — 3.47% CTR
The concept was strong enough to run three separate flights across January–March 2026: 166,530 impressions, 5,776 clicks, $1,199.84 spent. It beat the account average every time out.
Both live ad sets beat category
Meta's own industry benchmarking flags both currently-running August ad sets — cold Bridgeport-area prospecting and warm video-viewer retargeting — as performing above the benchmark for cost per click in their cohort.
One shoot a month.
Everything else is leverage.
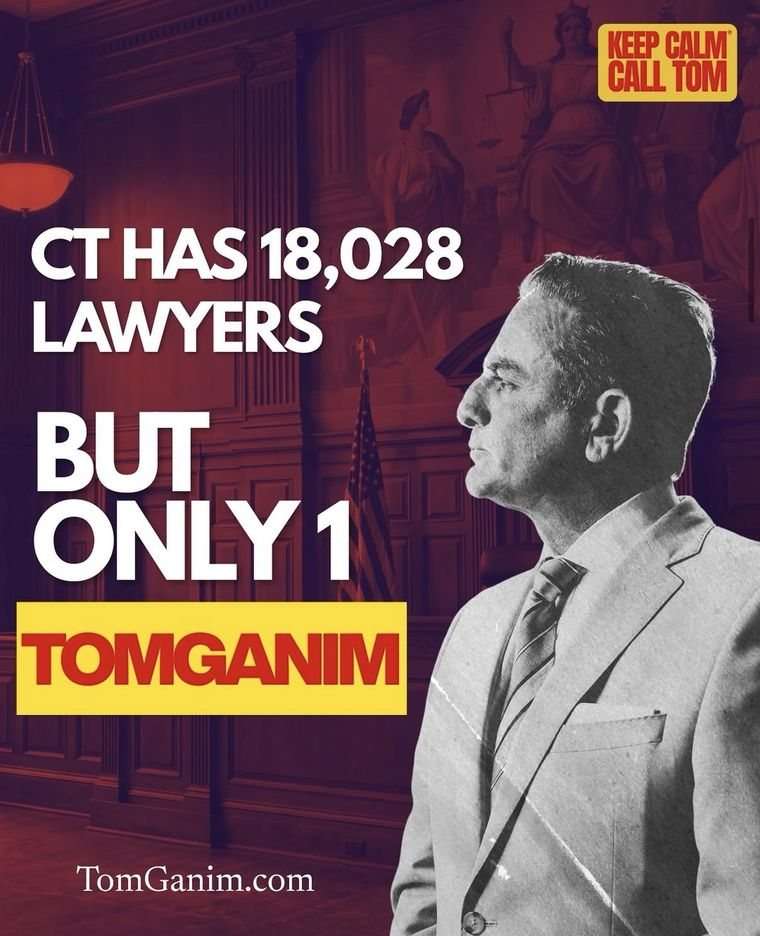
Eleven shoot days across the engagement. From those: 20 commercials, roughly 2,000 images and 100 graphics — every billboard, every spot, every post cut from the same source material.
Out-of-home


Stills, social & graphics
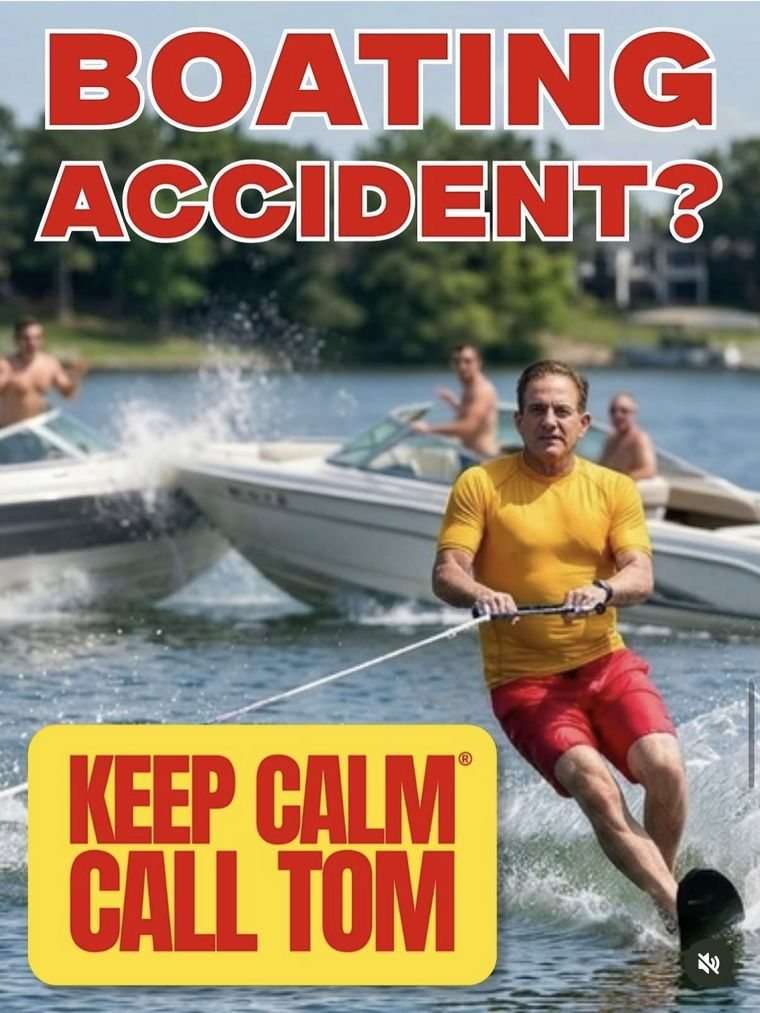

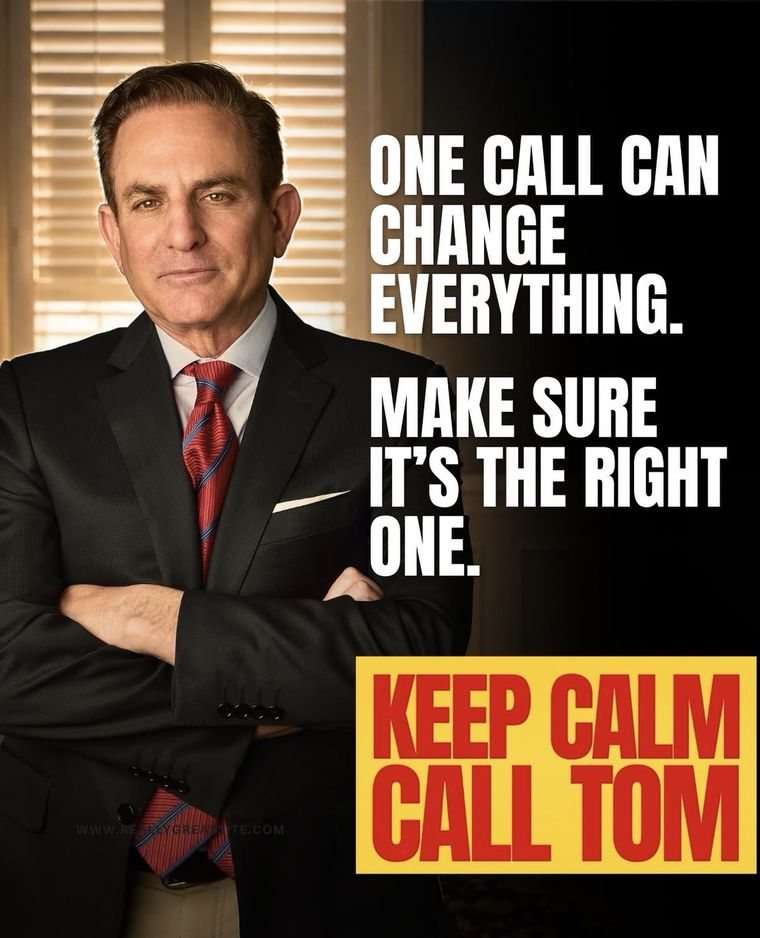


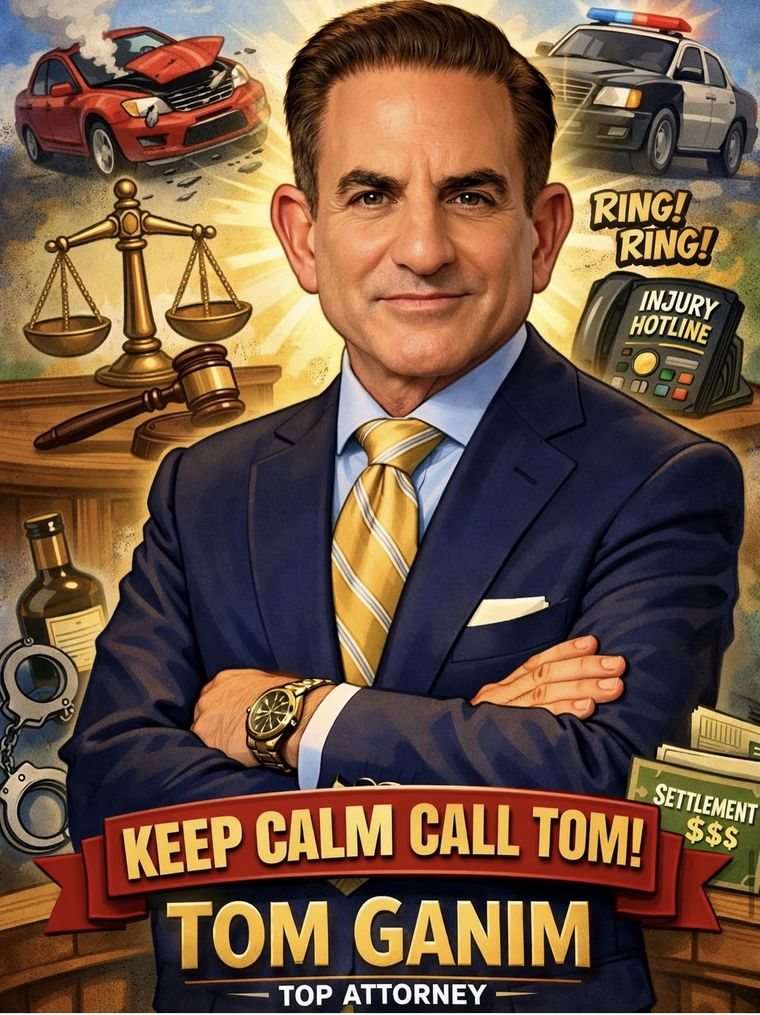
The work in motion
The full campaign library
Four spots is a sample. Every commercial, cutdown and social edit produced across the engagement lives in one place — so anyone who opens this can see the whole scope, not the highlight reel.
Paid is the smallest number on this page
Those 794,705 paid impressions are the part we can measure to the click. They sit on top of ten months of I-95 out-of-home, six months of cable television and continuous organic social — where most of the actual reach lives.
News 12 and the YES Network
Cable flights ran November 2025 through April 2026 with new inventory rolling now. Local news and live sports are the last two formats this audience still watches live — and the spots were cut from the same shoots as the social.
An AI-integrated pipeline
Concepting, variant generation, cutdowns and aspect-ratio versioning run through an AI-integrated pipeline. That's what makes a six-discipline retainer possible at this price point — 20 commercials, ~2,000 images, 100 graphics and 30+ boards off eleven shoot days.
Every ratio, every placement
One shoot yields 9:16 for reels and stories, 1:1 for feed, 16:9 for broadcast and pre-roll, and the wide horizontal crops the boards need. Nothing gets reshot because a placement changed.
Same budget.
Assets that outlive it.
His spend didn't balloon. Its composition changed — and for the first time, a meaningful share of it buys things that are still working a year later.
A six-figure buy, nothing to keep
Roughly half a million a year, almost entirely rate card — cable, billboards, radio. When a flight ended, the spend ended with it. No creative library, no reusable system, nothing carried into the next year.
The same money, plus a library
We negotiate and manage the media — billed direct, never marked up through us — and the creative comes out of the same budget. 20 commercials, ~2,000 images, 100 graphics and 30+ boards he owns outright and can re-run for years.
Inbound leads per week — before vs. now
Client-reported intake volume. The "now" figure is a range because weekly volume varies.
Website form submissions per week
The channel that produced nothing before the rebuild.
1 → 2–4 leads a week
Same firm, same market, same reputation. Web form submissions went from zero to about two a week alongside it — a channel that previously produced nothing at all.
1.6% of budget, 100% of the data
Paid social cost $8,193 across eleven months — a rounding error against his annual spend, and the only channel in the mix that reports to the click. It's where we test what the boards and spots then amplify.
1 line → 6 lines
The engagement grew sixfold in scope without a single pitch deck. He's hands-off by choice now — we negotiate the rates, manage the vendors and hand back the assets. Work that performs is the only upsell we run.